- Fatigue Technologies
- Constant Amplitude
- Fatigue Calculators
- Finders
- Technical Background
- Variable Amplitude
- Finite Element Model
- Multiaxial
- Probabilistic
- High Temperature
- Welded Structures
- Cast Iron
- Small Defect √ Area
- Utilities
- Languages
 日本語
日本語eFatigue gives you everything you need to perform state-of-the-art fatigue analysis over the web. Click here to learn more about eFatigue.
Glossary
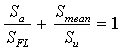
Goodman Diagram
Tension mean stresses reduce the fatigue life from that observed with completely reversed loading. The Goodman diagram, originally proposed in 1890, is a graphical representation of this effect.
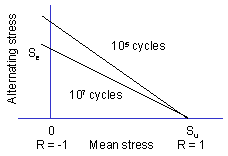
The alternating stress is plotted on one axis and the mean stress on the other. The allowable alternating stress with no mean stress is the fatigue limit. The maximum mean stress, with zero alternating stress, is the ultimate strength. A straight line is then drawn between the two points. Any combination of mean and alternating stress on this line will have the same fatigue life. Mathematically this may be expressed as: